Multiple interfaces

Hello all,

First of, want to thank the Quickbox team.
Amazing bundle you guys created!

Now, I’m not sure if this is a bug or something that I’m missing…

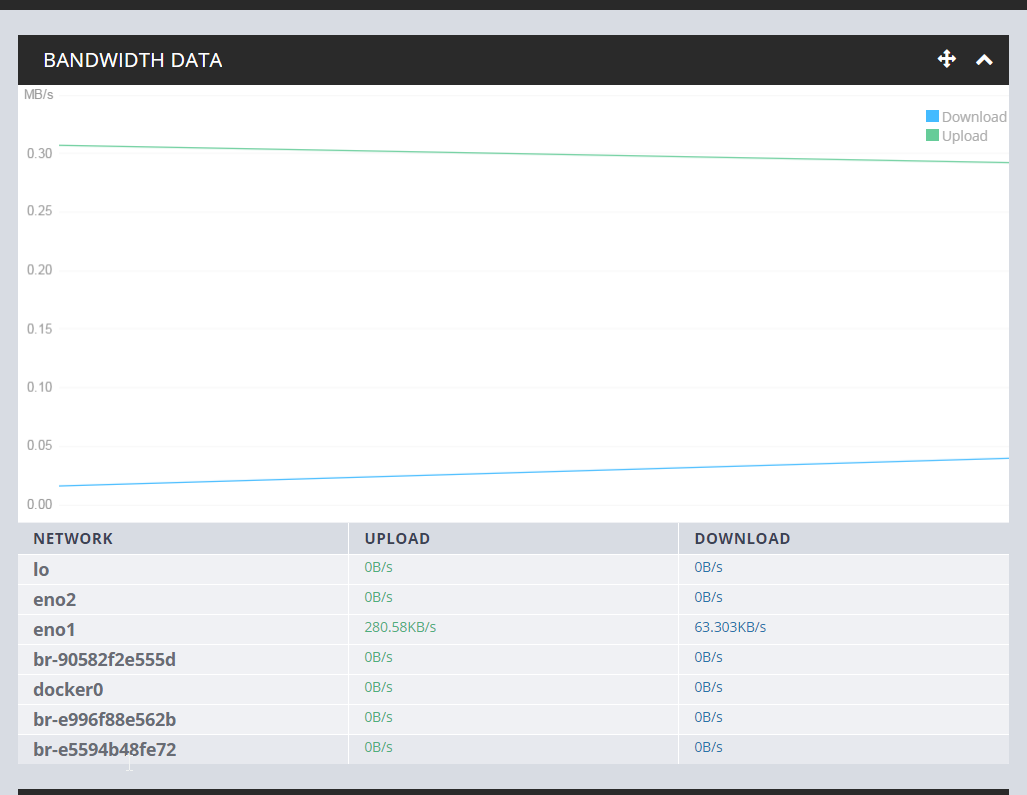
I have multiple interface on my server.
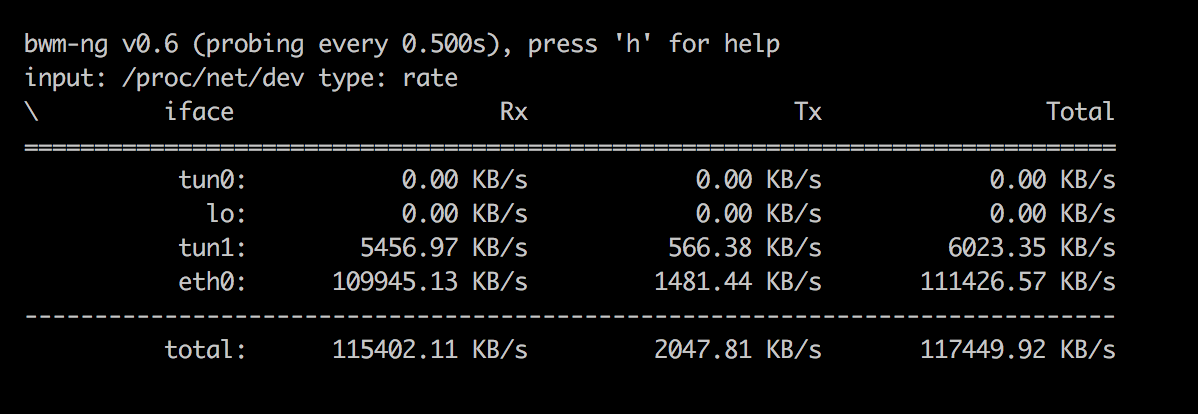
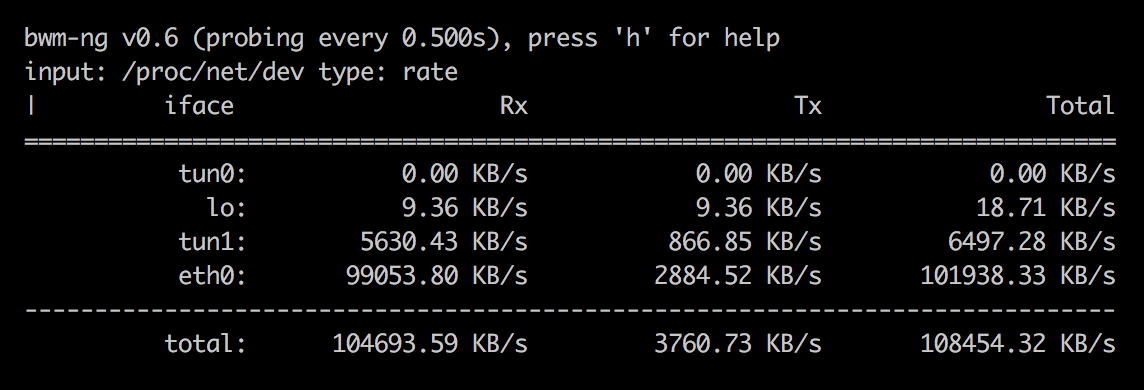
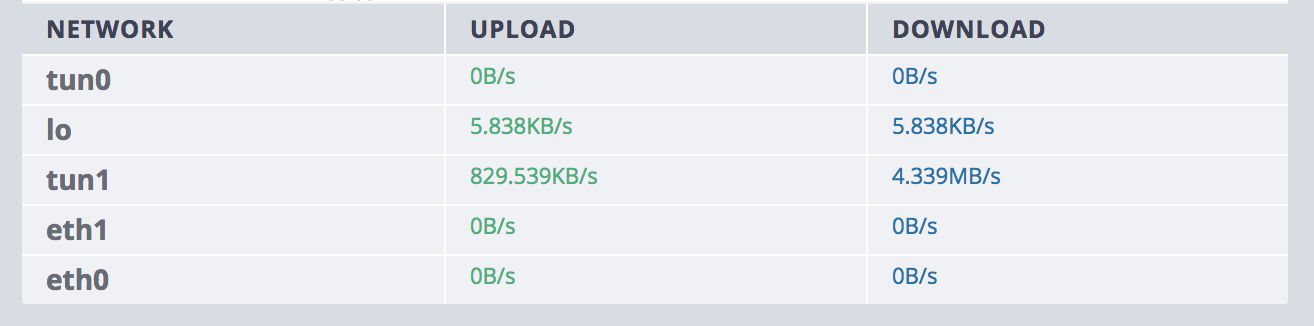
tun0 is the vpn server = no traffic atm
lo well …
tun1 vpn client is the iface that the torrent use (In split mode / only Deluge is bind)
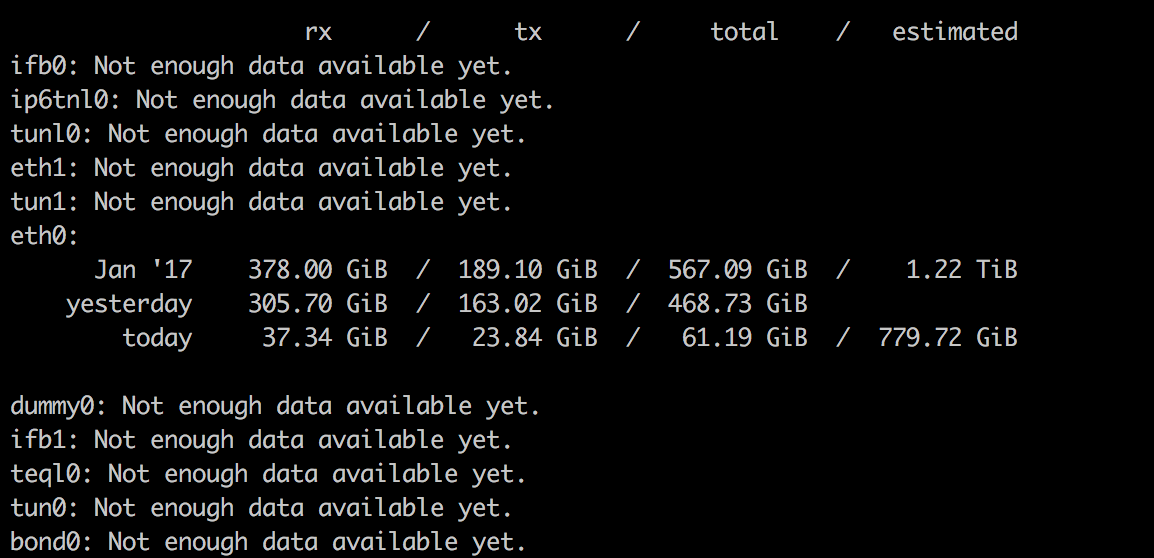
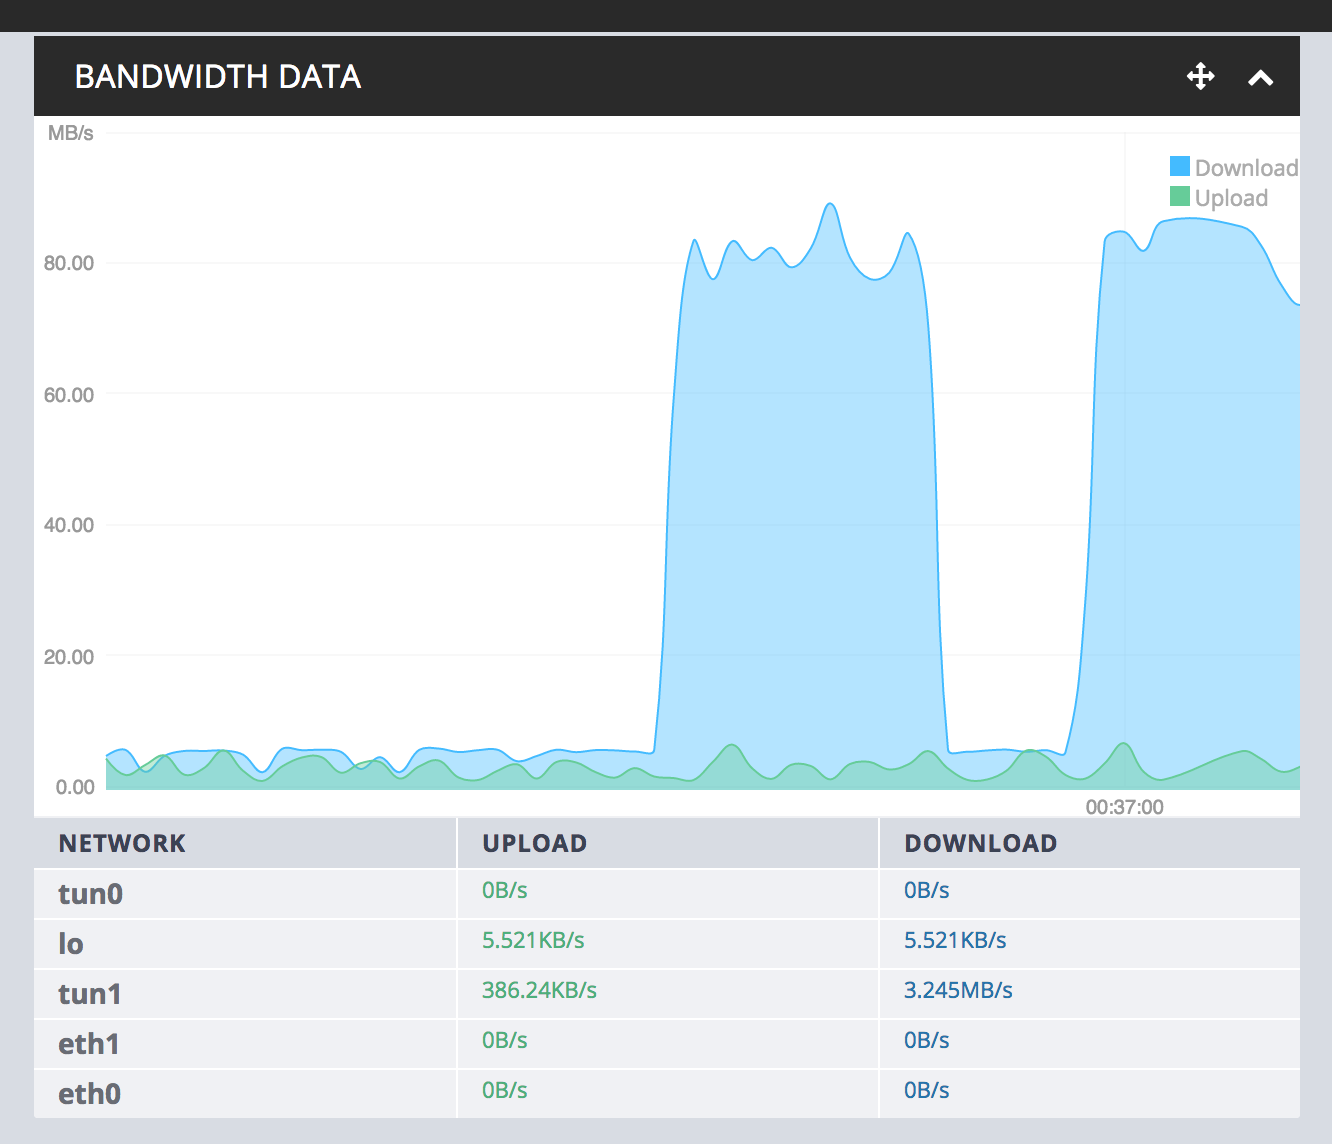
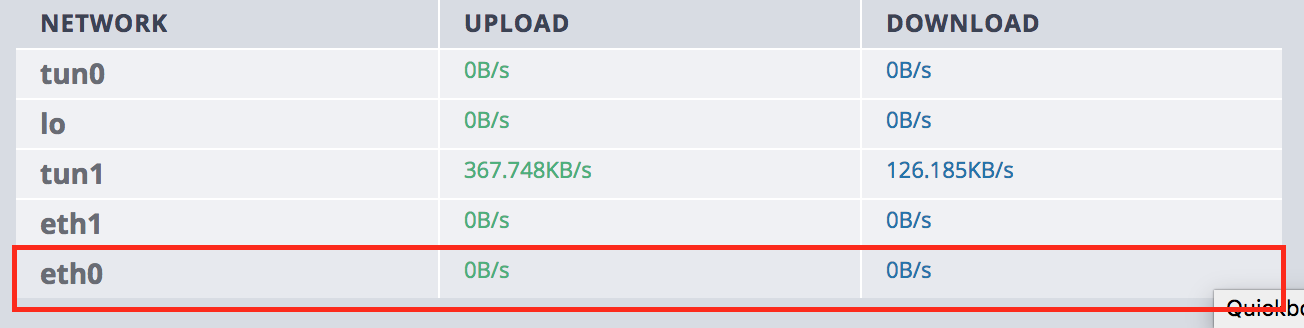
eth1 I don’t have ??? no clue why it’s showing up
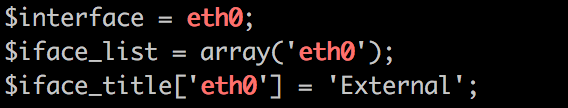
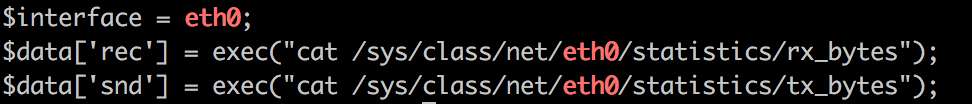
eth0 is my main iface

Now there’s traffic on tun1 as you can from the screenshot. This is good.
But eth0 is not showing any traffic. I know there’s some atm IE Plex (as I’m watching some moveis)

So basically, is there a way for me to first remove the eth1 and then make eth0 traffic show up?

thank you

This isn’t a bug, rather it is showing all available and active adapters on your setup. tun1/0 is either you have openvpn installed or are running via a VM of some sort. What’s happening from the screenshot is it looks like since a VPN is open then all traffic is passing through said adapter.

At least, these are the typical circumstances… if this is happening outside of that scope… this is really the first I have heard of it and it is more than likely something going on with your VM and QuickBox is merely reading these settings via vnstat.

When you type in vnstat, what is the output received. You can additionally do vnstat -l for live traffic flow. This way we can verify if for some reason the GUI is mixing up it’s language (which I don’t see happening honestly)

Thanks for you answer.

Actually, the VPN is in split mode. Meaning only the torrent traffic get’s routed through it. Everything else goes to through eth0.

Here’s a screenshot of bwm-ng where you can clearly see the split:

Here’s a screenshot of vnstat -l showing that it’s only monitoring eth0:

Even in bwm-ng we don’t see the iface eth1 and we clearly see the diff between eth0 and tun1 (vpn client) vs tun0 is the vpn server.

Screenshot of vnstat as you requested.

Thanks

What do the following commands show:

grep 'eth0' /srv/rutorrent/home/inc/config.php
and
grep 'eth0' /srv/rutorrent/home/db/interface.txt
and
grep 'eth0' /srv/rutorrent/home/widgets/stat.php

Figure out eth1.
OVH server with a second NIC that Iv’e never configured.
So this issue is fixed.

Still not seeing any data for eth0 :confused:

Update:
The bandwidth is now showing up in the graph section of the bandwidth data.
Nothing on the “details” part tho.

Thanks

I’m fairly positive that second “unused” nic is in fact the IPMI network adapter and not for use in WAN activities.

Hello Liara,

The second network interface (eth1) that is not in used is in fact OVH private interface.
Nothing to do with the IPMI network.

It is normal that no traffic is being recorded as I’m not using it.

The only issue remaining ATM is that eth0 is not showing up in the “details” view. (The one that gives you the upload/download speed. (it is showing up in the graph tho…)

AKA: Data not showing up / real time updating here:

Thanks

I’m having this same issue, but with relation to docker networks. If I have all my containers off, eth0 shows correctly. Once I start my containers eth0 stops showing any data in the details, but the graph works fine. I’m guessing this is a bug, but has it been deemed as one yet?

It’s not a bug as it is doing exactly what it’s supposed to do. That still doesn’t make it fun to face when you are running docker containers. This is something I am pretty sure our own @RXWatcher has faced and I think, already knows a fix for it. Either way, this is something we’ll get cleaned up soon as it should simply show just the main interface.

It seems if there are more than 4 interfaces showing eth0 stops working. Either way I hope @RXWatcher gets it fixed soon. It would be nice to show all the interfaces in the details portion. :slight_smile:

Well, it’s not up to him to fix it, only pointing out he knows the why and the how. I will address this soon as time permits. It’s a possibility we’ll show them all (somewhere), we really just need the main active ones to be present in the initial network tables.

I’m not having the issue…while its a tad ugly, I’m not seeing it freeze up. The br-* are custom docker networks.
My docker0 is the default docker bridge but not bound to the same IP as QB. I have a ton of IPs on my server so I just bound QB to the main IP and I have docker using another IP. That allows me to work on docker without it interfering with QB.

Edit…now I can reproduce it. In my case its specific to my traefik docker container. I stop Traefik and the issue goes away.