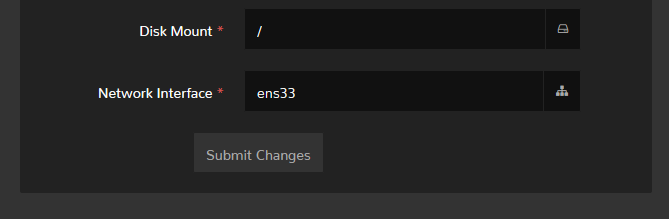
Glad you sorted that out. The recent update made a change to the database location of the interface that is pulled for the charts. Instead of being in a standalone column it is now part of the configurations column. This was to enable the ability to adjust the interface should it change for whatever reason.
The setting can be found on the General Settings page:
If qb update grafana doesn’t work for some, it may be due to a hotfix that was released right after the initial update to adjust a couple of things. So if it’s still acting up, you can run qb fix version to grab this hotfix and from there it should adjust automatically.