
Would be nice to see grafana support added to quickbox. If you haven’t seen it take a look, pretty awesome dashboards can be built using it.
Hello @deano,
I just looked Graphana and it’s clear that it’s beautiful and efficient 
When we look the softwares integration that it supports (Graphite Elasticsearch Cloudwatch Prometheus InfluxDB & More), it seems to be oriented for web applications teams who need reports from databases and web performance.
But I love the dashboard concept and it could be really helpful (and cool  ) to have it for managing ours QuickBox servers. I can even imagine a little Raspberry with it’s LCD screen with my QuickBox dashboard just beside my TV (thing like that ie).
Do you know this other software for dashboard named Dashing?
You can look a little demo here : http://dashingdemo.herokuapp.com/sample
Because for that we will need to find physical metrics (CPU load. RAM, network upload/download, etc.) from other softwares like Netdata or Glances to retrieve data. And some other developpements which should be useful and cool to display (i.e) :
- realtime transcoding process (from PlexPy),
- the last movie added (from PlexPy),
- new requests from PlexRequests,
- etc.
Anyway, I think it’s a really cool idea but it demands a bit of work
Everyone, do you need dashboard application like Graphana or Dashing for your QuickBox servers ?
EDIT : Graphana is really nice  https://grafana.net/dashboards/893 and plugins really useful!
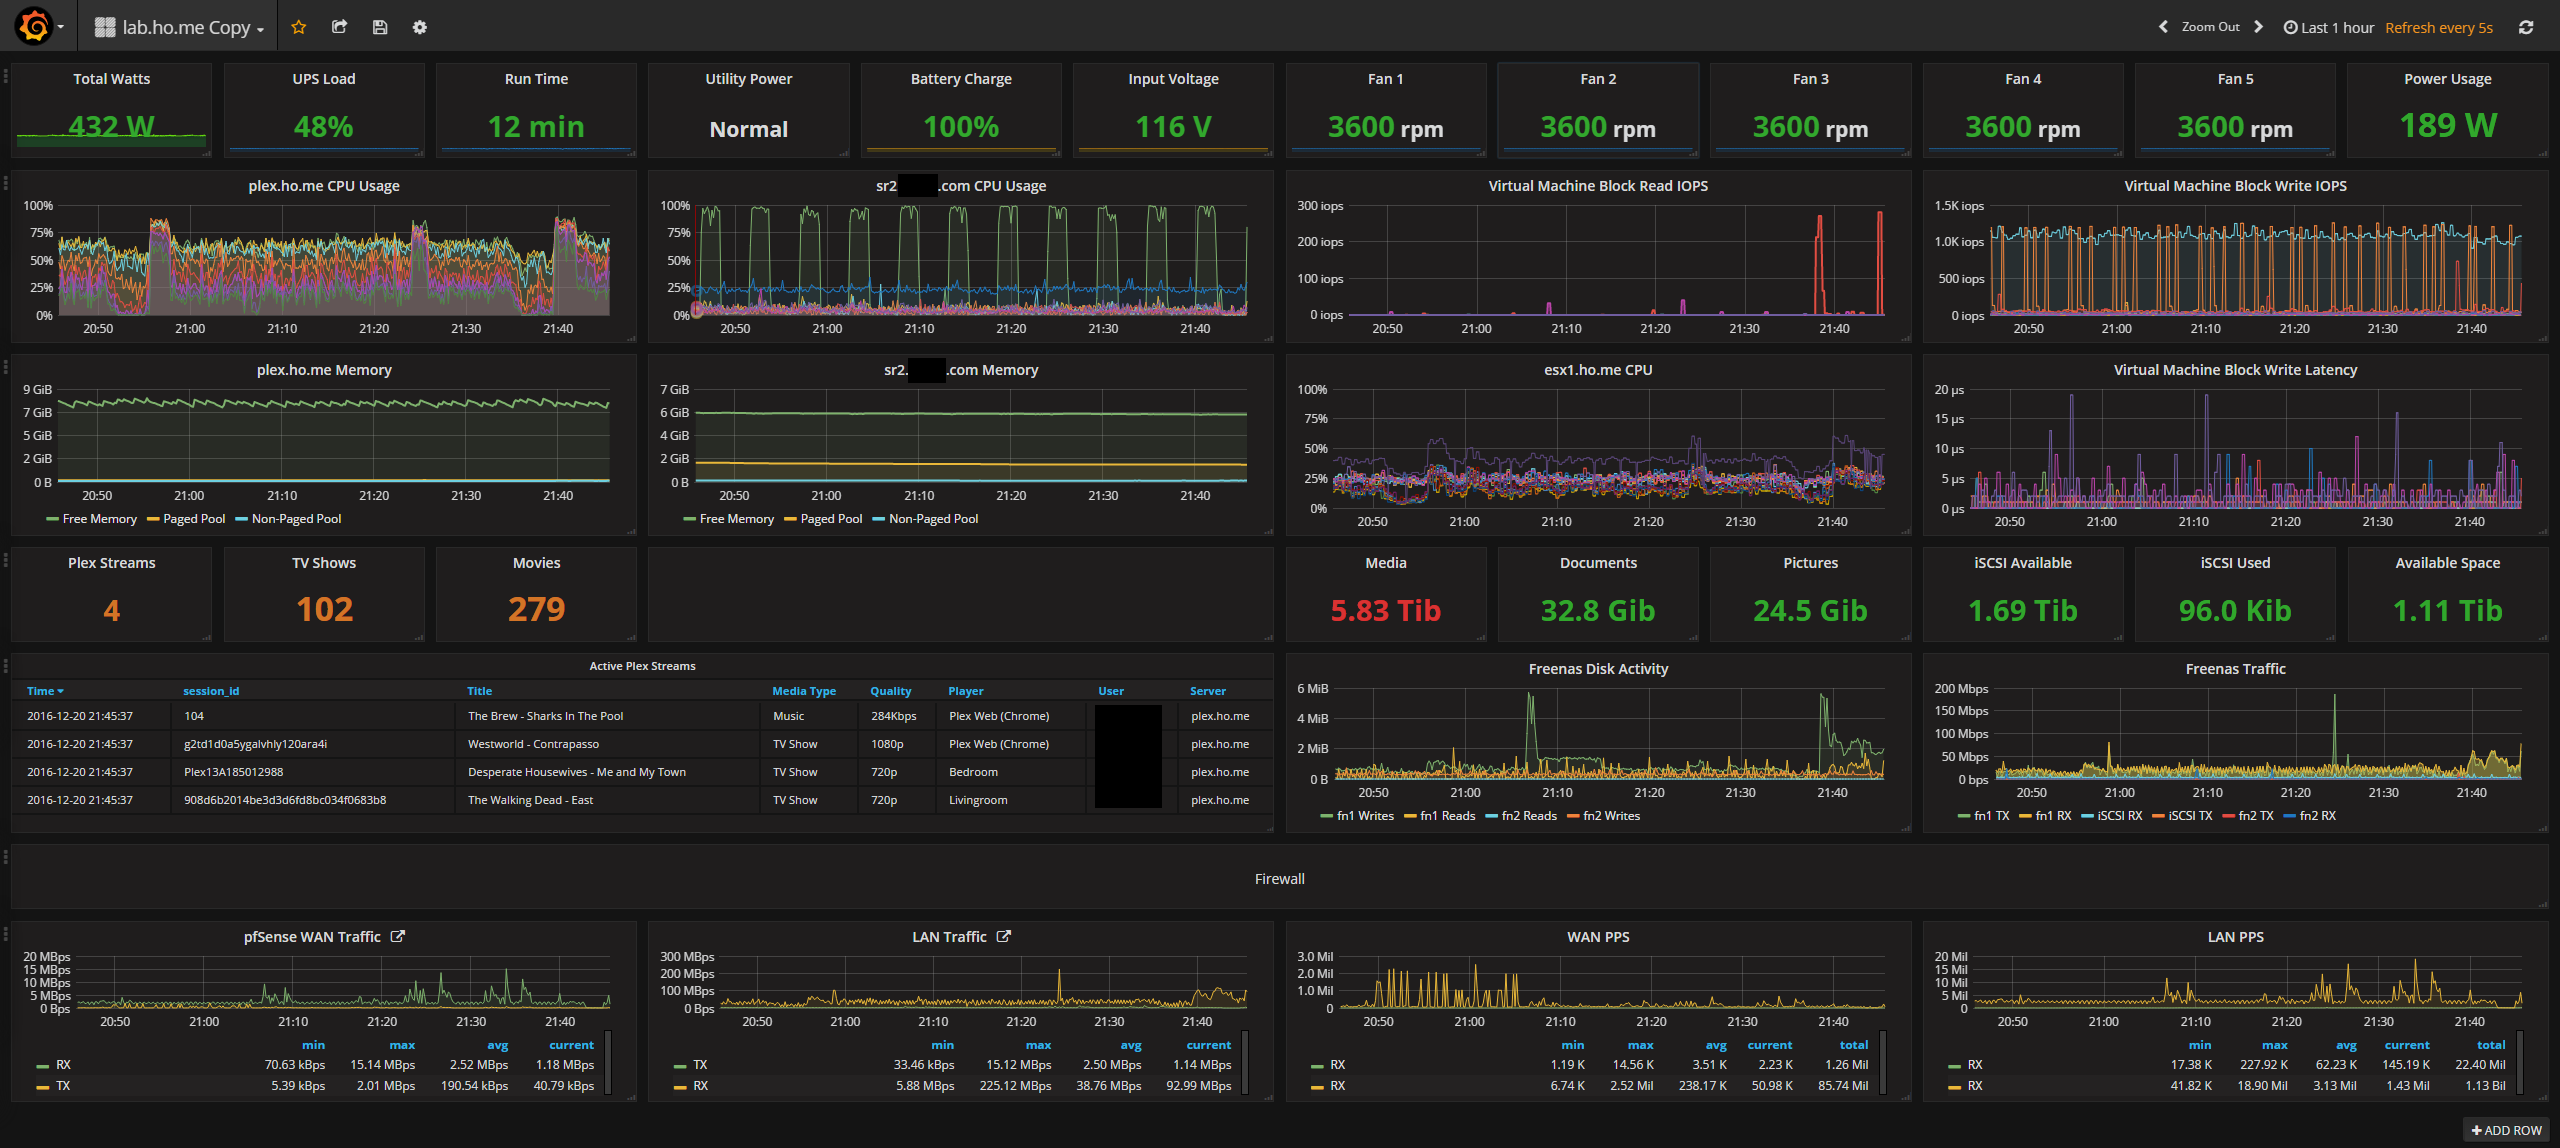
Grafana gets pretty deep, but setting it up is somewhat a pia. Heres a good example of how you can handle plex stats within it.
It’s cool !
I searched if there is a Plex plugin currently available for Graphrana but it seems there is not yet.
I will install grafana in few days and try to make a first dashboard
When you do install here’s the tutorial I followed for Ubuntu server 16.04 LTS. http://tinyurl.com/z8sc4cl. I have QB installed on the VM as well. Just be careful he has some typos in some commands.
Here’s a way of getting Plex stats via collectd http://tinyurl.com/z2hucg8
Haven’t tried this out since I don’t use Rtorrent but if that’s your kinda thing here’s a way of monitoring that as well. https://muling.lu/rtorrent-graphite Like I said, not sure if it works.
I dug around everywhere to try to find a way to pull Deluge stats but to no avail.
Enjoy
1 Like
so i am looking over this app.
Notes
-
easy to install the app it self.
-
getting running easy
-
has its own systemd startup already.
-
configuring so that you can use graphs and what not takes little work. * this will be the hard part for adding to quickbox
-
by default it is using http not https but config allows the ability to use ssl certs and https
1 Like
Looks like this one will be a shoo in. Who doesn’t love pretty graphs!?
3 Likes
That would be awesome!
As for dashboards, you’d only have to set it up once. Then simply export/import it, seems it wouldn’t be to large an issue. Probably could even have it pre installed and selected as default. So long as all the backend is there to be pulled from.
Hopefully I found a way to get Deluge stats into it, hit a snag and am currently trying to get a work around. Once I get it going, I’ll build a dashboard and share my progress here.
1 Like
Wow!!
didn’t know Grafana before!! Thanks for sharing!! Seems to be very very cool, useful and efficent!! I really hope that it would be implemented!!
I installed Grafana and started to create my first dashboard.
The first thing I can notice is that we need to install 2 applications in addition of Grafana :
- one application database to store metrics (influxdb for me)
- one application to collect metrics and populates the database (netdata/glances/etc)
The configuration is not too hard but needs to be carefully done. I think it could be difficult to propose one script that installs every applications and make configurations between them. I guess the most simple should be to make a QB docker container that will provide everything we need
To be continued!
1 Like
Glad to see your playing with it, not very hard to get going. Pulling data is the hard part. Think your spot on with docker, its what I’ve been playing with these last few days in my homelab. Easiest way to present it, and easy enough to upgrade/remove.
Only problem is deluge and rtorrent stats, which imo would separate the homelab dashboards from seedbox dashboards. There’s a few scripts out there, but they are dated. I’ve reached out for help and hopefully I’ll have something to share in the coming days.
Are you installing in docker? There’s a quick guide https://cyanserver.com/grafana-the-absolute-beginners-guide/ that will get you going in minutes within docker.
I’m thinking of building a box out with nothing but docker.
I dont really want a full stack QuickBox in a single docker. I would rather have the quickbox panel in a docker and then indv dockers linked up via docker compose or something like this:
https://dzone.com/articles/logging-a-docker-environment-with-portainer-or-not looks interesting for managing it all.
I guess a full stack docker would be nice for some to get up and going fast but I want the flexibility to work with indv dockers from DockerHub, etc.
2 Likes
Deluge is being worked on now, with other’s to come.