Hi
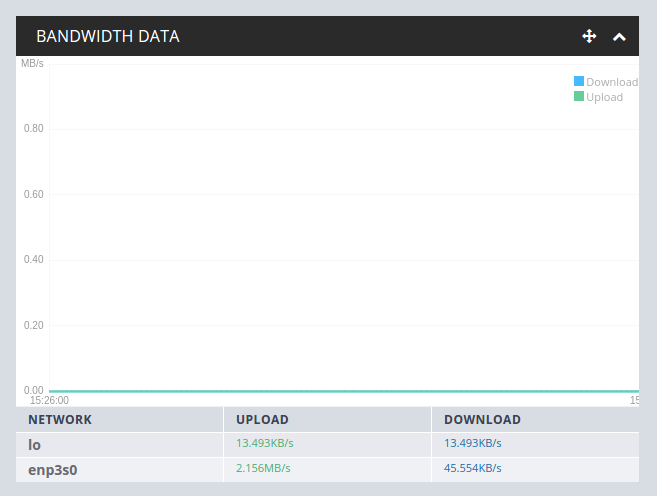
Since I performed a “box upgrade” today that the bandwidth data module is blank in the graphic part, but shows the real speeds below…
Any help?
Thank you 

Hi
Since I performed a “box upgrade” today that the bandwidth data module is blank in the graphic part, but shows the real speeds below…
Any help?
Thank you
You’ve probably already figured out that after an update it takes the interface no more than 3 minutes to perform it’s update… then the data will populate the graph once more. Are you still not seeing the graph?
No, it’s all white with a bottom green line that doesn’t reflect the speeds
Thanks for your quick reply
I think this is a result of a recent pull request I accepted. it looks like he placed the INTEFACE inside single quotes which then causes the sed command to fail on inserting your adapter.
Can you tell me in your srv/rutorrent/home/widgets/data.php file on line #2 if it is blank, or if it shows your adapter.
https://github.com/QuickBox/quickbox_dashboard/blob/master/widgets/data.php#L2
I did reinstall the whole system because the hard drive was going nuts, and replaced it with a new one; everything is fine and the bandwidth graphic is displaying fine.
Thank you very much