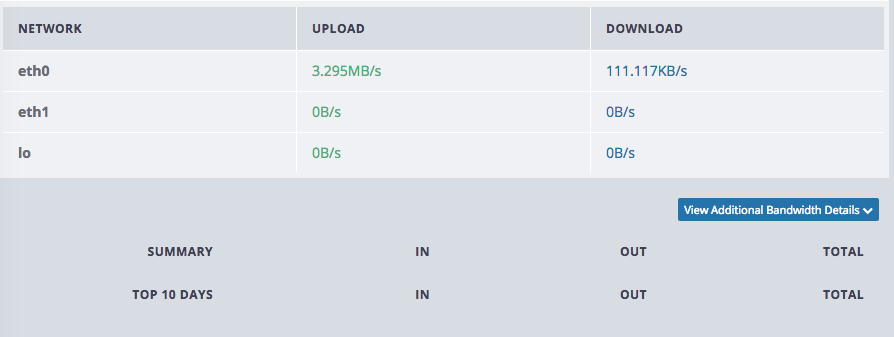
Do I have to enable anything extra for the additional info to show up?
Debian 8 - Quickbox 2.3 - online.net server


Do I have to enable anything extra for the additional info to show up?
Debian 8 - Quickbox 2.3 - online.net server

Ok, I have fixed the issue, just update your dashboard to have the data update. After running the update give it about 1 minute for the system to implant your active network interface to the charts.
cd /srv/rutorrent/home
git reset --hard origin/master
Now wait 1 minute and your data will update appropriately.
This is actually a bug in my php… I will submit a fix for this shortly. @liara, this fix should solve the issues for all Distro and Rel
This seems to be a bug in vnstat that is only affecting Debian installs.
I am going to continue to work out why this is happening as it is creating the databases in /var/lib/vnstat and the permissions are proper. Once I have some concrete findings on this I will post an update which will be easy to follow up on from your end.
As per that post above, on some servers a reboot fixed this and some not… it really seems to be hit or miss.
I’ve run the 2 commands and even rebooted… waited 5 minutes… still nothing…
If you need any additional info, let me know…
ok, did this and it worked after…
git stash (because… > Please, commit your changes or stash them before you can merge.)
git pull
Cheers!
@JMSolo, this bug is slightly different from the bug I was encountering on my own server. This bug is indeed because of the interface being set incorrectly.
In my specific instance, I had thrown the panel onto an existing installation of Debian 8. My issue didn’t look similar to the screenshot (in fact I was able to replicate the screenshot by changing the interface to a bogus value). In my specific case, the bug was that you would click Additional Bandwidth Details and the dropdown would not drop.
I later realized that this was specifically in relation to the if $username == “$master” and somehow the comparison returns invalid / false.
echo $username
liara
echo $master
liara
Yet if($username == “$master”) doesn’t seem to compare ( http://puu.sh/pivmg/d5aff1e99f.png , http://puu.sh/pivzF/69632e89ac.png ) Given that I’ve only run into this issue on a server I back ported the panel to, I’m going to chalk it up to something I don’t really care about and leave it alone.
http://puu.sh/pivF4/aa1b375c38.png – This is the culprit here. I don’t understand php well enough to understand why it isn’t working here but just fine everywhere else.
Edit: Further investigation shows the $master variable is tacking on a space somewhere so $master = "liara " and $username = “liara” (spoiler alert: the extra space doesn’t exist in the master.txt file  ) . The solution here is to trim extra whitespace from the variable in inc/config.php
`$master=preg_replace(’/\s+/’, ‘’, $master);
I do not think this needs to be implemented in the repos because this strange behavior has not cropped up on a single other installation.
Thank you for the fix! It works now.
ok, it shows data BUT it’s not correct.
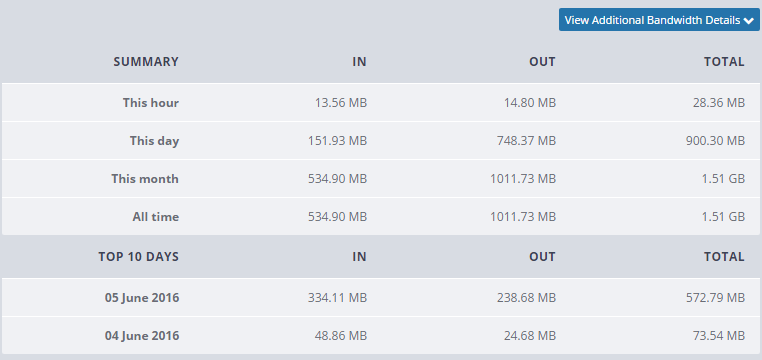
I added a 10GB torrent this morning and it shows me (6 hours later):

‘This day’ is updated every 12 and 24 hours. It more than likely accumulated the original input/output of data and has yet to update. Keep an eye on it and let me know after a few more hours. This data is handled by vnstat so the limitations (if any exist) would be via that package and not QuickBox.
ok, It’s just strange that “this hour” and “this day” are identical…
Login to ssh and type vnstat -u -i eth0. Replace eth0 with whatever your active network interface is. See if this forces an update of those stats on the dashboard.
It did update and then while I was looking it overwrote “this day” with the “this hour” info… (making it less then it should be again…)
So it fell back to the values that were there previously? I will need to fire up a Debian machine here within the hour and see if this is simply a Debian bug or better. On Ubuntu installs this issue is not happening. I will additionally review the php code to see if I doubled any charts on accident.
this is what it is now… compare that to the one above…

After I ran vnstat -u -i eth0, I briefly had GB values in the “This day” row…
from what I can tell, every time it updates the “This hour” row, it copies it also to the “This day” row
Thank you for the info. I will run this against Debian here shortly. I just ran samples against Ubuntu and the issues are non-existent and it is producing accurate readouts. I do tend to neglect Debian in some cases… I’ll test this one and hunt down any errors with a follow up on my findings (if any).

I agree, that is unusual.
Update: now that we’re in a new hour it seems to be updating properly, I watched it update 3 times and it was correct
Maybe running the update in between screwed it up earlier?

The totals for this day are still wrong, but at least it’s not duplicating now…
My graph is not changing + I don`t have any stats in SUMMARY section.
Ubuntu 16.04
